Information design
According to the University of Minnesota, human brains process visuals 60,000 times faster than text. So adding visual information along with other data, helps increase processing and decision-making.
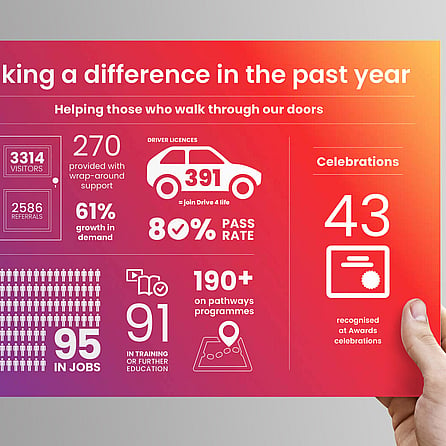
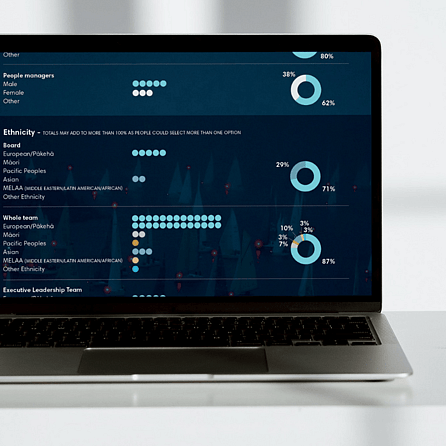
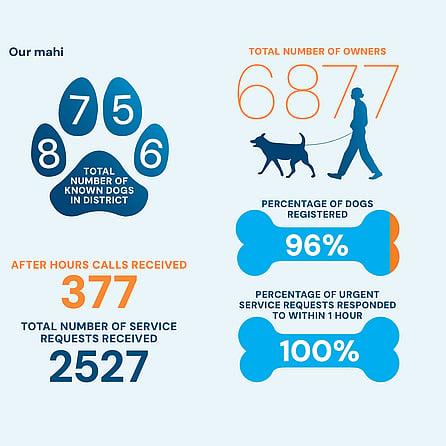
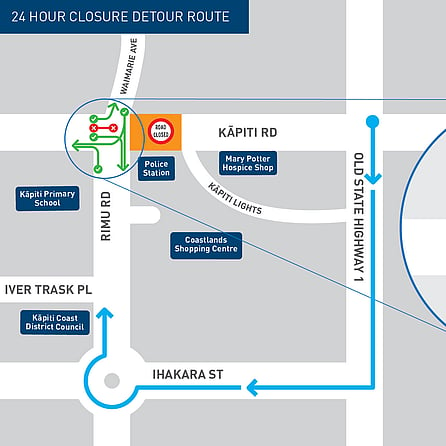
Transforming data into engaging, easy-to-digest visuals and information design:
Infographics
Maps
Diagrams, tables and custom icons
Facts-on-a-page
Interpretive signs and exhibition panels
Visual storytelling to help you:
Simplify and shine a light on complex or technical information
Give heirarchy and highlight facts to reflect your priorities
Help your audience navigate and act on information in online or physical spaces
Ready to get your messages across with visual impact?Ready to help your audience understand your information so they can respond to it? Need help with information design?
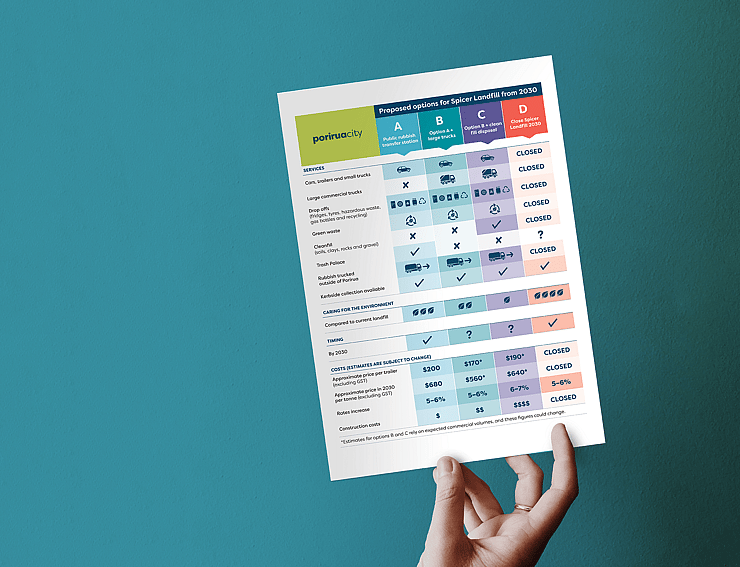
Case study:
Porirua City Council –
Spicer Landfill public consultation information design
"Jane’s concepts were fresh and exciting"
"We found working with Jane from Pogo Design to be a pleasure. She was very efficient and helpful. Jane’s concepts were fresh and exciting and the finished products were a perfect fit for purpose."
Michelle Robinson, Former Executive Director
Partners Porirua